

The Straits Times Index (STI) has been a closely watched market barometer for the last 50 years - the decades in which modern Singapore was created and transformed into a global financial centre.
During this period, the Singapore Exchange (SGX) has gone through many peaks and troughs, with the latter including the Pan-Electric crisis in 1985, the global stock market crash in 1987, the 1997 Asian financial crisis and, a decade later, the global financial crisis.
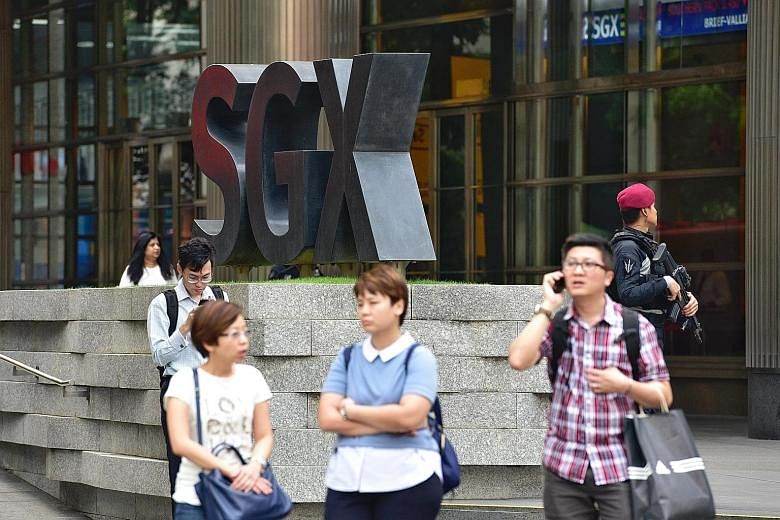
The most globally recognised benchmark index for Singapore, the STI tracks the performance of the 30 largest and most liquid firms listed on the SGX. It is used as the basis for a range of financial products, including exchange-traded funds (ETFs), warrants, futures and other derivatives.
Last Thursday, the STI hit a 22-month high of 3,271.11 points. A slight pullback a day later saw it closing at 3,255.29, down 15.82 points. It is a far cry from its humble beginnings, when its starting value was a mere 100 points.
As the STI celebrates its 50th- year milestone this year, here are some highlights.

How the STI began
This household name, whose highs and lows have pointed to fortunes made or lost for retail investors and heavyweight players, started in a modest way.
Its precursor was an index compiled by The Straits Times as far back as April 1958, called the Straits Times Industrial Index (STII), which measured the price movements of industrial stocks.

Its actual base rate dates from Dec 30, 1966, and the starting value was 100 points. The first public mention of the index was on Jan 4, 1967, in The Straits Times' stock market section - which covered the then Stock Exchange of Malaysia and Singapore. The STII had 29 constituents.
On Aug 28, 1998, the STII bowed out at 885.26 amid a global market sell-off. In its place, the value- weighted STI was created and launched with 55 component stocks. Unlike the STII, the STI covered the main sectors of the then Stock Exchange of Singapore, embracing institutional darlings such as the local banks. To ensure continuity, its commencing base picked up from where the STII left off.
The primary aim of the STI is to reflect the trading activity of listed stocks in Singapore and to reflect the performance of the local economy, particularly the earnings of listed firms. The STI is weighted by market capitalisation, making it less susceptible to manipulation. This means the impact of a component's price change will be proportional to its market value, unlike the price-weighted STII. In addition, for a stock to be included in the STI, liquidity is a key selection criterion.
On Jan 10, 2008, the STI underwent a major revamp which saw its 47 component stocks cut to 30 blue chips. They capture about 80 per cent of the total market cap of firms listed on SGX. At the same time, a family of 18 new FTSE ST indexes, covering various sectors as well as smaller firms and China-based companies, was launched.

The joint initiative of Singapore Press Holdings, SGX and global index provider Britain's FTSE Group aimed to make the index more reflective of the market and accessible to investors.
Again, to ensure continuity, the opening value of the revamped STI was the same as the previous STI's closing value. And to facilitate historical analysis of the revamped STI, a re-created history going back to Aug 31, 1999 was generated.
STI today SGX market strategist Geoff Howie said that although the STI today is very different from the STII, the significant economic lineage remains a key strength of the STI.
"The foundations of these 30 different STI stocks span as many as three centuries - from the Jardine Matheson Group in the 1880s to Hutchison Port Holdings Trust in the 2010s.
"The STI also spans well-established local businesses like City Developments which listed in 1963, and key regional plays like Golden-Agri Resources, which was founded 33 years later," said Mr Howie.
The STI and the family of FTSE ST indexes are reviewed regularly. This explains why the composition of the index has changed over time. For instance, since the start of 2010, the STI has seen 11 new inclusions. Of the 11, nine are still part of the STI - with one of the nine, Jardine Matheson Holdings, a re-entrant. Mr Howie noted the 11 stocks have averaged 36.1 per cent total returns from the respective announced inclusions to May 11.
Ten of the stocks are still listed, while CapitaMalls Asia, which was included in the STI on March 22, 2010, is now a wholly owned unit of CapitaLand.
The best performer of the STI inclusions since 2010 was Thai Beverage and the poorest performer was Hutchison Port Trust Holdings.
Recent STI performances
Mr Howie worked out that for the 15 years ended April 30, 2017, the STI has outpaced leading Asia benchmarks such as the Hang Seng Index, the Nikkei 225 Index, the MSCI AC Asia Index and the MSCI AC Asia Pacific Index.
During this period, the STI generated a whopping 283 per cent total return in US-dollar terms, and the total dividend-inclusive return in Singapore-dollar terms was 195 per cent.
Over the last five years, the STI sector which performed the strongest was the banks, with all three stocks averaging 59.3 per cent total returns.
The STI has also been a comparatively strong performer in the shorter term, with 15 per cent Sing-dollar total returns from the start of this year to May 11.
Mr Howie said: "Year-to-date, Yangzijiang Shipbuilding Holdings has been the strongest of the 30 STI constituents. The shipbuilder, with an outstanding order book ranking of No. 1 in China and fourth in the world, recently celebrated 10 years of listing on SGX.
"The four next best STI performers consisted of three real estate developers and DBS Group Holdings."
Shares of Singapore-focused real estate developers firmed following the Government's March 10 announcement on the relaxation of some cooling measures in the residential market.
Real estate developers with exposure to China have also performed comparatively well on the firmer performance of mainland property markets.
Together, Global Logistic Properties, City Developments, CapitaLand, UOL Group and Hongkong Land Holdings have averaged 26 per cent total returns this year, bringing their average five-year total returns to 55.1 per cent, added Mr Howie.
The STI has also consistently maintained one of the highest dividend yields across Asia, with the annual yield at 3.4 per cent as of the end of April. This compared to an average of 2.5 per cent for the FTSE indexes of China, Japan, India, Hong Kong, Indonesia, Malaysia and Thailand, he said.
STI ETFs
Financial experts say a key development for the STI over the past 15 years has been the listing of STI ETFs, which made the STI investable.
STI ETFs that follow the performance of the STI benchmark have provided access to these returns, while also mirroring the changes to STI constituents over the years.
There are two ETFs tracking the STI that retail investors can invest in: the SPDR STI ETF and the Nikko AM Singapore STI ETF. The SPDR STI ETF has the longer track record, dating to April 17, 2002.
"Since inception, an investor would have received an annualised 7.3 per cent return over the past 15 years, not including dividends which are distributed on a semi-annual basis.
"This is quite decent, considering the sharp correction suffered in 2008 due to the global financial crisis," said Mr Daryl Liew, Reyl Singapore's head of portfolio management.
Mr Howie pointed out that by including STI ETFs in their portfolios, investors will automatically have exposure to the 30 biggest active Singapore stocks, which can change over time.
He noted that the STI ETF has outpaced the Hang Seng Index as well as other Asia benchmarks in the past 15 years.
Real Estate Investment Trusts (Reits)
Reits have made the most recent impact on the STI, with three of them included in the STI.
Not surprisingly, three Reits are now part of the five-stock STI Reserve List which comprises Suntec Reit, Mapletree Commercial Trust, Keppel Reit, Sembcorp Marine and First Resources.
As Ernst & Young noted in its Global IPO Trends: Q1 2017 Report, the SGX continues to be the preferred choice for Reits and business trusts, underscoring investors' preference and appetite for yield-based products in Singapore.
SEE INVEST