Check property prices, market trends with new analytics tool and 3D interactive map
Sign up now: Get ST's newsletters delivered to your inbox

Mogul.sg chief executive Gerald Sim said the platform simplifies property-related data and cuts the time and money needed to sell properties.
ST PHOTO: KUA CHEE SIONG
Follow topic:
SINGAPORE – For the first time, home buyers and sellers in Singapore will be able to see the asking and transacted prices of properties on an interactive map.
The free tool, developed and launched on Tuesday by property portal Mogul.sg, pulls data from sources including the Building and Construction Authority, the Housing Board and partnering estate agencies.
It uses a gaming engine to create the map, which allows it to load faster, even on mobile devices.
Property prices are typically displayed in charts and tables, but users need to refer to separate maps to inspect the locations and amenities.
With Mogul.sg’s analytics tool – the DataSuite and an enhanced 3D map – buyers and sellers can get estimates of the property’s value and better visualise where the most expensive or cheapest homes are located.
The final price that buyers paid can be seen only on a separate 2D map for now, but it will be merged with the 3D version that shows the listed prices within the next six months, Mogul.sg chief executive and founder Gerald Sim said.
For a $150 administrative fee, sellers can also list their property on the portal and be assigned an agent to handle buyer inquiries. Users will not have to pay any additional commission that often racks up to tens of thousands of dollars with traditional property agents, added Mr Sim.
Agents instead get a cut of the $150 fee and have much of the paperwork handled for them.
The software can also generate an estimated value of a property using its machine learning algorithms that consider a location’s past sales, geography and amenities like schools, transport and malls.
Mr Sim said the platform simplifies unwieldy property-related data, and cuts the time and money needed to sell properties by digitalising the process. Verification will soon be sped up by extracting information from national identity app Singpass, once approval is granted.
He added: “Until now, home owners have not been able to access rich points of data that truly determine the value of their home, and had to rely on third parties to help them.”
Mr Sim, who founded Mogul.sg in 2018, added: “Instead of browsing many property listings, home owners can now study property values in a 3D map that provides a deeper understanding of the location.”
The DataSuite feature helps users to evaluate information on HDB units, condominiums and landed properties. The information is presented in charts and diagrams based on a user’s preferences, like the type of housing, location and the year the home was built.
The data can be plotted on a diagram that provides an overview such as the range of prices that buyers are settling for – and pinpoint any anomalies, like buyers who forked out more than usual for homes in a neighbourhood.
For example, a diagram of four- and five-room HDB flats sold in Choa Chu Kang since September 2022 indicates that prices have remained mostly constant, from around $300,000 to $800,000.

Scattergram of four- and five-room flats sold in Choa Chu Kang.
PHOTO: SCREENGRAB FROM MOGUL.SG
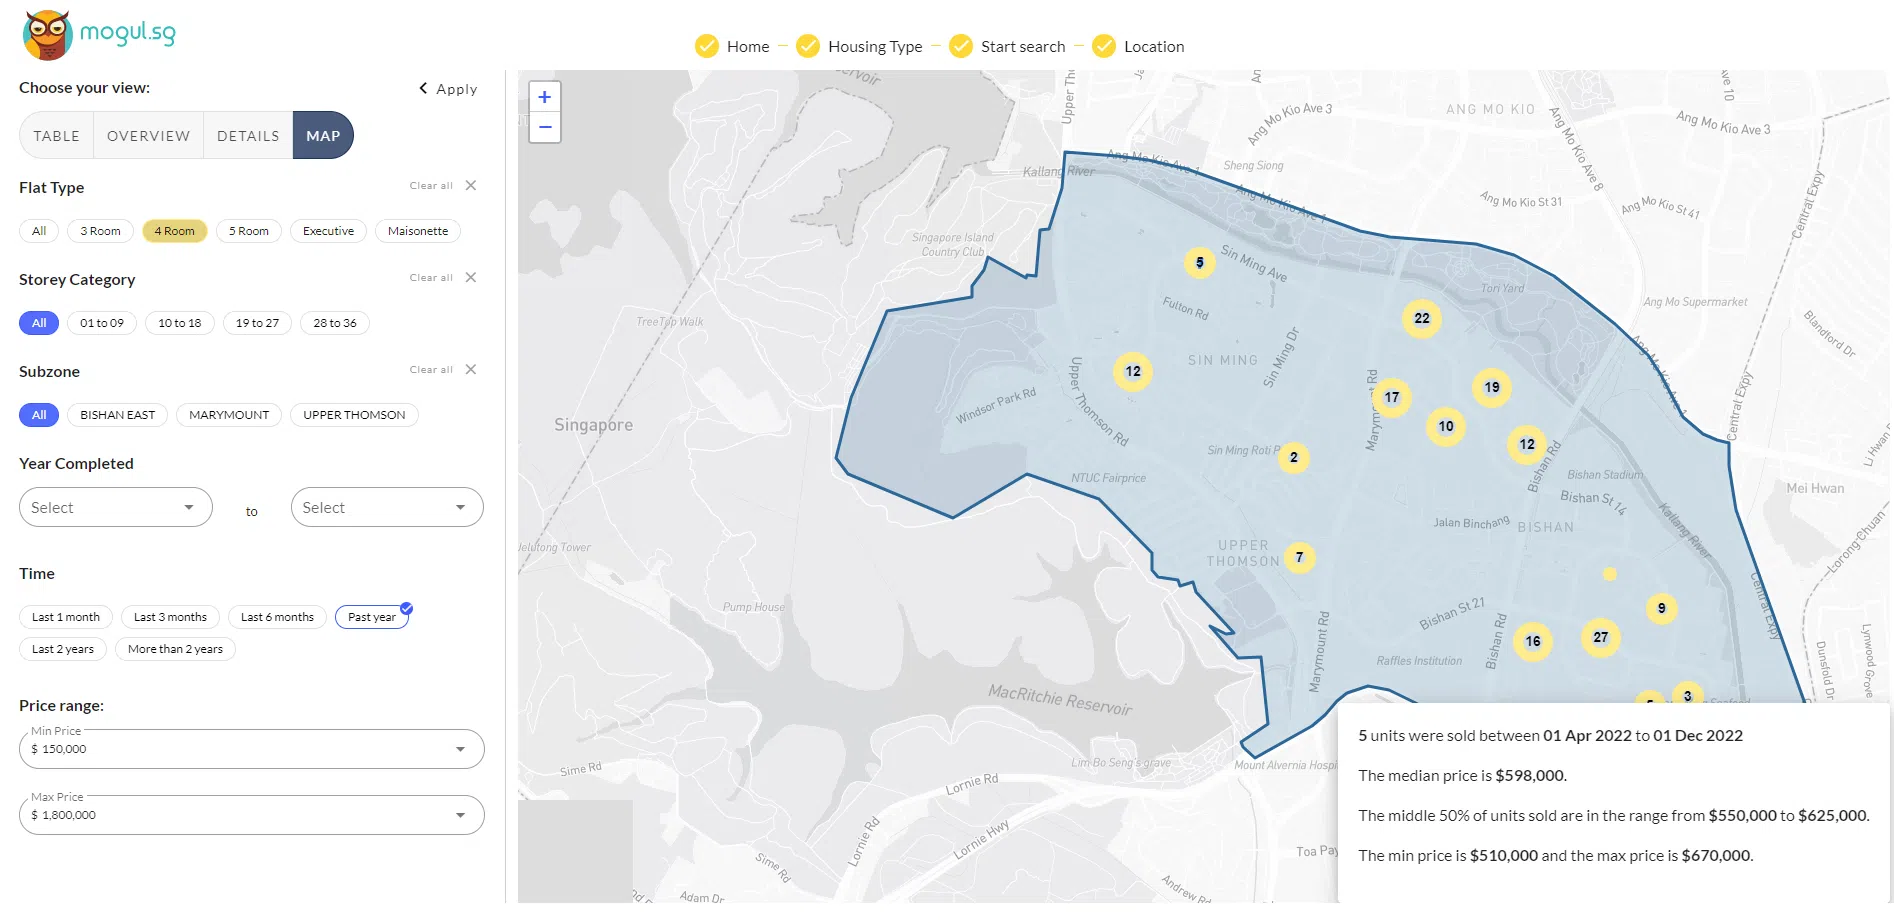
The data can also be presented on a map to show the number of homes sold in various locations. The software also summarises the median and range of transacted prices.
To build the portal, the Mogul.sg team tapped sales figures in open databases from government agencies, and others from partnering property agents, said Mr Sim.
The algorithm can also trawl through open-source data and check for updates regularly to ensure the dimensions of the buildings on its map and listed prices are up to date.

Four-room flats sold in Bishan since September 2022, presented on a map on Mogul.sg.
PHOTO: SCREENGRAB FROM MOGUL.SG
The data accounts for nearly half of the buildings in Mogul.sg’s digital 3D rendering of Singapore, launched in 2022 to help buyers inspect properties in 3D and check how much direct sunlight a unit may receive.
Real estate developers can choose to advertise projects on the 3D map, which will be able to show detailed mock-ups of what the homes will look like when completed.

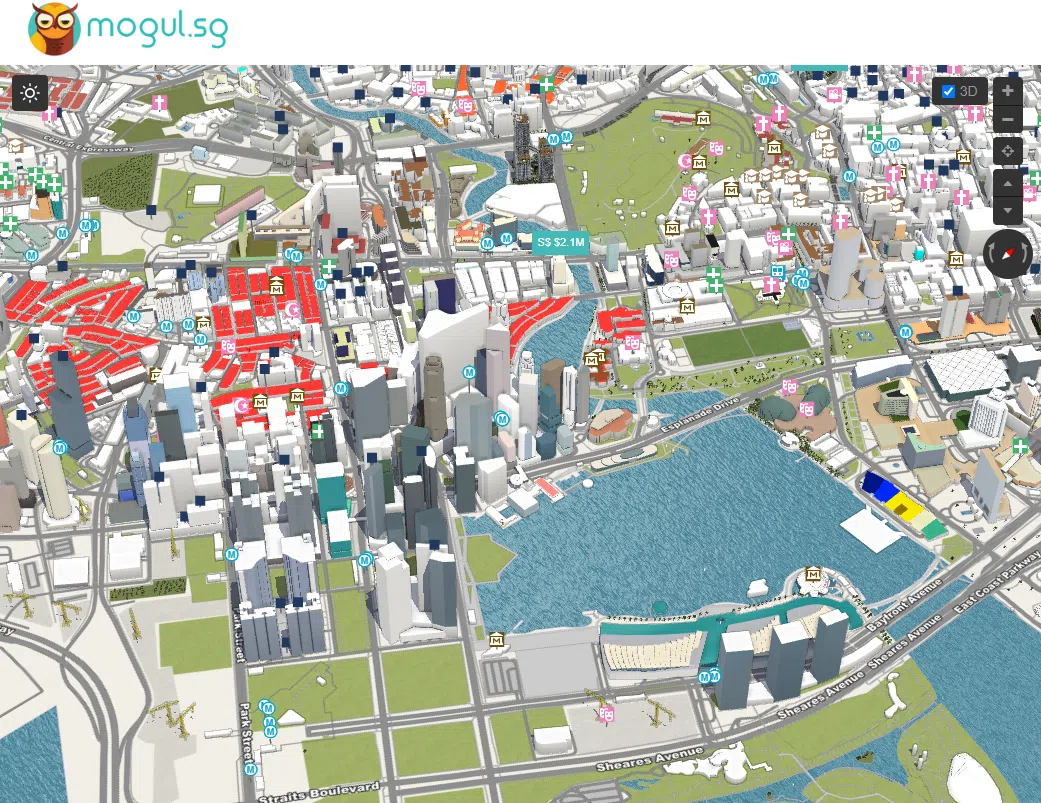
Render of the Marina Bay area on Mogul.sg’s 3D map.
PHOTO: SCREENGRAB FROM MOGUL.SG
Powered by a gaming engine produced by French digital application firm F4, Mogul.sg’s render uses vector graphics that allow users to zoom in and out of the map – even between buildings – without losing any quality or detail.
Vector maps are generally lighter to load than virtual maps built using photogrammetry, which require software to align and mesh 2D images onto a 3D model and can become distorted when zoomed into, as they are more taxing to render.
Mogul.sg’s platform adds to a selection of property portals that buyers, sellers and agents can turn to to study trends. OneMap, developed by the Singapore Land Authority, shows property prices, land ownership, the nearest amenities and demographic data, plotted against a 2D map.
Mogul.sg has plans to expand its 3D mapping service to other countries.

