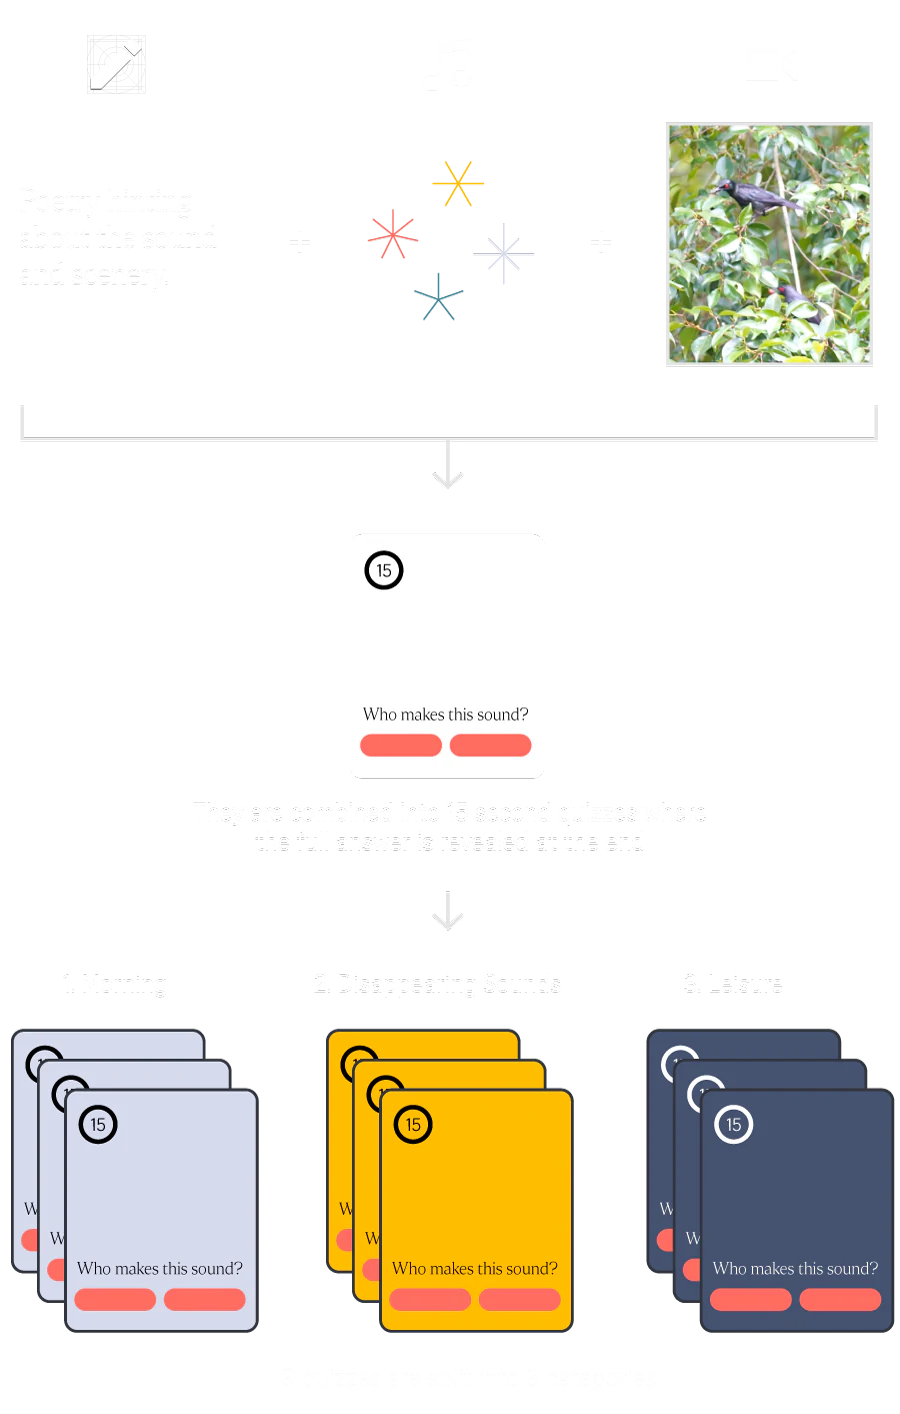
We began by capturing video and audio from diverse Singaporean soundscapes, venturing from HDB blocks in Marsiling to underpasses along Orchard Road. We created nine short scenes, each filmed in portrait orientation. These audio files were then processed using three programs, each generating animated shapes based on specific sound features.
The animated shapes, along with audio and video footage, were compiled into 15-second collages. Each one opens with a poem, followed by shapes that animate without the video before gradually revealing segments of the footage.
These 15-second clips are presented as interactive quizzes, challenging readers to identify the sounds as quickly as possible before the complete video is revealed.
We built three programs to capture sounds and visualise them in three different ways. We built them with JavaScript libraries, mainly p5.js. A mini version of each of the three visualisers is also available on this page, click on them and toggle the mic to play with them in real-time!
#1
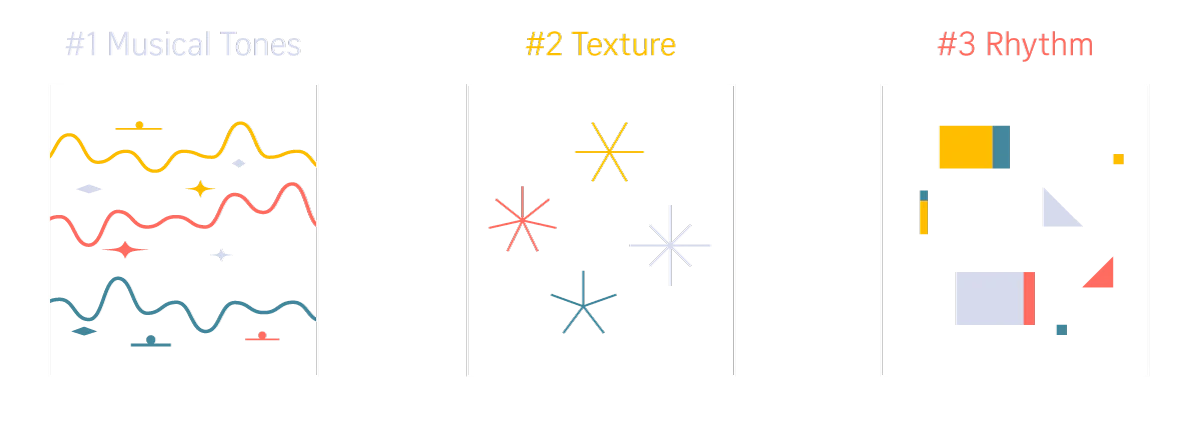
Musical Tones
This visualiser maps musical tones and pitches to colours and shapes. Shapes that look bright, light and rounded were used to illustrate the tones. Some resemble musical notes on sheet music, some look like they are floating on air.
At its core, it listens to the audio's frequency spectrum, breaking down sounds into their constituent pitches. Each pitch corresponds to a specific frequency, and this frequency can be used to drive visual parameters, as seen in the legend below.
JavaScript libraries like ml5.js and p5.js were used to detect pitch and amplitude from either a microphone or a sound file. The data was visualised dynamically using algorithms through a trail, as well as through the shapes with their widths matching how long each pitch lasted.
#2
Texture
Some sounds are hard to decipher, noisy and more textural in general – the sound of roasting chestnuts, for instance. This visualiser translates the texture of sound into dynamic, radiating patterns that evolve based on the audio's amplitude, or volume level. At the core of the system is the Amplitude object from the p5.js library, which analyses how loud the sound is. The louder the sound, the more energetic the visual response, affecting the size and complexity of the displayed shapes. The Starburst class defines these shapes: star-like figures with rays extending from a central point. These rays' lengths are randomised to give a more organic, irregular feel, and they react dynamically to the audio input.
As the amplitude of the sound changes, each starburst's rays fluctuate in length and number. The variable level, which represents the current sound intensity, is fed into the display method of each starburst, modulating the ray lengths in real time.
Elements of symmetry, randomness and responsiveness are combined to create a dynamic representation of sound texture that shifts and changes with the music. In this way, the visualiser portrays sound not just as a sequence of tones or beats, but as an evolving, multidimensional texture.
#3
Rhythm
This visualiser represents the rhythm of sound by generating floating shapes that appear when the audio reaches peaks in its waveform, synchronised with the sound’s rhythm. The code works by analysing the audio file's peaks, which are points where the sound's volume or intensity spikes. These peaks are detected using a neighbour comparison function findPeakIndices(), which finds the highest points in the sound's amplitude over a small range. When the sound reaches a peak that surpasses a threshold, a visual "floater" is created - an abstract shape that moves upwards, representing that peak in the rhythm.
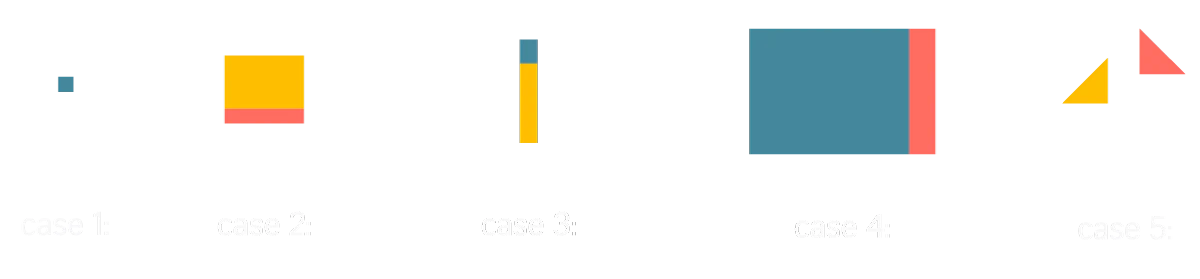
From small chirps to hard chopping, five hard-edged shapes are designed for beats of all ranges. Each floater is rendered with one of the five shapes based on the volume level at that peak. For example, louder peaks create larger shapes, which could range from squares, rectangles to triangles, depending on the mapped intensity.
The code allows for user interaction by adjusting settings such as the threshold for detecting peaks peakThreshold, the minimum volume required to generate a floater minVolumeThreshold, and the block duration, which determines how long each portion of the waveform is displayed. A waveform can also be shown alongside the floaters for a clearer representation of the sound's structure. In this way, the visualiser offers a dynamic and abstract way to visualise rhythm by mapping sound peaks to graphical elements that pulse and shift in sync with the audio's beat.
Separating sounds using multiple mics and isolator software
To better isolate sounds, we strategically placed mics around a scene. For example, a mic close to a sizzling pan captured the sound of frying roti prata in vivid detail. We used the texture visualiser to depict the sizzling sound, while the rhythm visualiser illustrated the rhythmic dough-slapping.
We used an AI audio isolator to separate the guitar track from the vocal track in the street busking performance below. Using the two separate tracks, we generated two separate musical tone visualisers that animate very different trail waveforms and pitches.
Micro-Interactions and Sound in UI
This piece is sprinkled with micro-interactions, many of which are interactions with sound. For instance, when you enable the sound, a needle will scratch and start the record player with a record player pin sound in the background. When you scroll to the bottom of the article and scroll past the record player, it will stop the ending music and the needle will lift from the player.
Each of the three categories has a different background colour. A seamless transition is applied on scroll to signal this change in section.
The sound of each interaction is linked to its content. For instance, there are two interactions that are triggered on scroll in the explainer portion of the article. They each show three graphics, and a tone plays for each graphic. If the next graphic is placed on the same height or higher than the previous one, the accompanying tone will have a high tone. If the next graphic is positioned lower, the tone will be lower than the previous one.
The quiz buttons share the same music visualisers as the ones used in the video collages. They have both the correct and incorrect sounds fed into the visualisers and the animation generated is overlaid onto the buttons. This not only amplifies the feedback experience when getting a right or wrong answer, but it also unifies the entire interactive piece with a cohesive art direction.
Experience the article here.