You may never make it to the South Pole, but you can now see Antarctica and its glaciers in unprecedented detail.
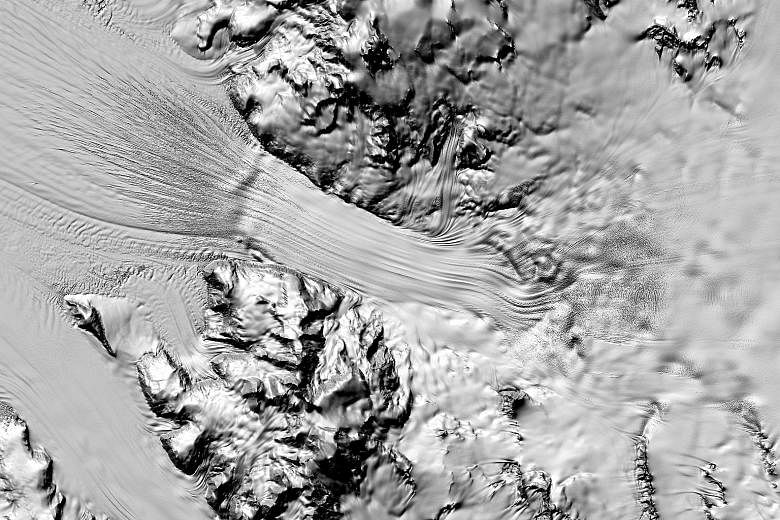
Researchers have announced the release of a new high-resolution terrain map of the southernmost continent, called the Reference Elevation Model of Antarctica, or Rema, which they say makes Antarctica the best-mapped continent on earth.
Antarctica is the most desolate and inhospitable place on earth, and its remoteness makes monitoring changes in ice and water levels difficult. Because of the warming climate, seasonal changes at Antarctica are becoming more severe, making the need to understand the loss of ice even more important.
Dr Ian Howat, the project's principal investigator and a professor of earth sciences at Ohio State University, and University of Minnesota's Paul Morin used data from a constellation of polar orbiting satellites to image the frozen wastes. The satellites are owned by the National Geospatial-Intelligence Agency, which is part of the US Department of Defence.
Previous maps of the continent had a resolution similar to seeing the whole of New York City's Central Park from a satellite. With this new data, it is possible to see down to the size of a car, and even smaller in some areas. The data is so complete that scientists now know the height of every feature on the continent down to a few feet.
"If you're someone that needs glasses to see, it's a bit like being almost blind and putting on glasses for the first time and seeing 20/20," said Dr Howat.
The team used 187,585 images collected over six years to create the map. The pictures are so detailed that researchers had to use one of the most powerful supercomputers on earth to ingest the data.
"Until now, we've had a better map of Mars than we've had of Antarctica," said Dr Howat.
Observing snowfall, ice growth and the rate of melt and fissures will allow scientists to monitor sea-level rise and glacial melt with more accuracy. Ice shelves bear the brunt of pressure from flowing rivers pushing against them. The faster the ice melts on the land, the more weight the ice shelf has to contain, resulting in breaks of glaciers into the sea.
And because of the location of Antarctica, and because, for the rest of the year, there is not enough sunlight at the poles for the satellites to see the land, images can be taken only from December through March, the summer season.
Explorers and scientists stationed at Antarctica will also find the map useful. By having such a detailed topographical map, new routes to science stations can be planned around the continent's dangerous terrain.
"Something that's always been a problem is knowing where the ice is and knowing how thick it is," Dr Howat said.
The 150-terabyte data set is the first to allow researchers to watch the fracturing of ice shells within a three-week time span, nearly tracking changes on the ice in real time.
The researchers hope to update the map every year.
NYTIMES